Debugging an Application
Before starting this section you can test your importing skills by downloading and importing this file. Find the imported file in the "Package Explorer" on the left and double click it to edit it.
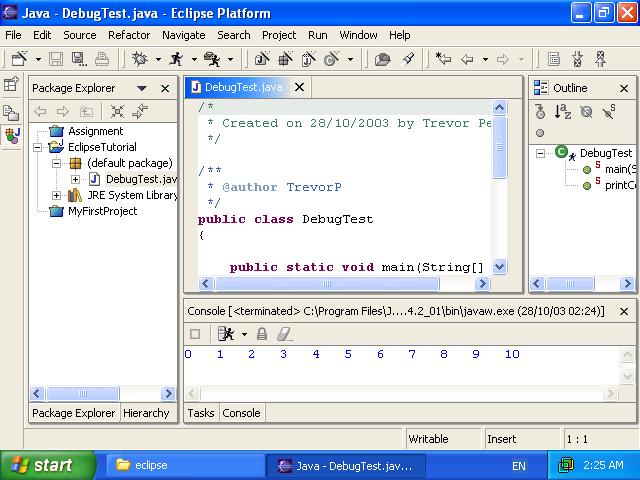
You should be able to run this file straight away, by selecting the "Run" drop down arrow, choosing "Run as", then "Java Application".
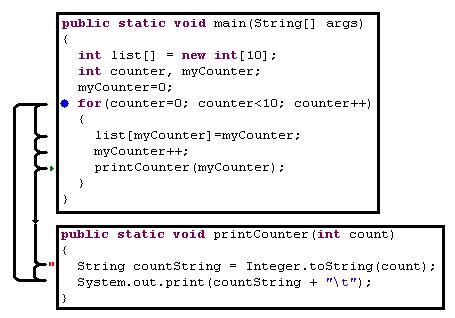
As you can see, this program contains two methods, a main method, and a printCounter method. The main method loops using a for loop, and repeatedly calls printCounter, passing a different number each time. printCounter, simply prints the number followed by a tab character.
To start debugging, click the drop down arrow to the right of the "Debug Project" icon (the little bug) , choose "Debug As" and choose "Java Application". Eclipse will change to the "Debug Perspective" before running the application.
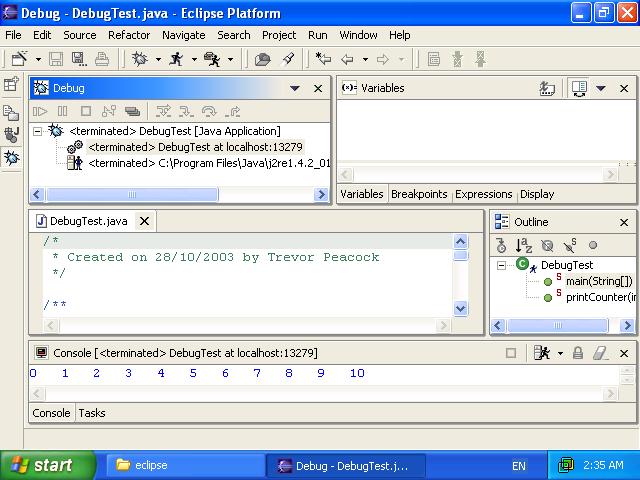
You will notice a new icon down the left hand side of the screen. This is the "Debug Perspective" icon. You can use these icons (the "Debug Perspective" and "Java Perspective" buttons) to switch between perspectives.
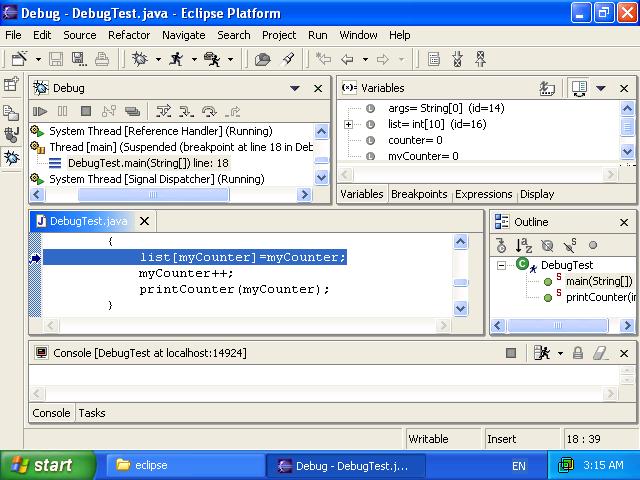
A quick introduction to the features of the "Debug Perspective".
The "Debug" view can be seen up the top left. This box shows all previous
executions (runs) of the file. Although the contents of this box are a little
complicated, we needn't concern ourselves with it. The important bit is the icons
at the top, the little play icon, the pause and stop icons, and the arrows to
their right.
To the right of the Debug view is the "Variables" view. While a program is
paused, this view shows all variables in use, and their values. As well as
simple variables, it will show the contents of arrays and other complex objects
and data types.
The program ran straight through that time. Lets add a breakpoint to start debugging properly. Find the line "list[myCounter]=myCounter;" and right click on the grey (or possibly blue) bar down the left hand side of the edit view at a point just to the left of that line of code.
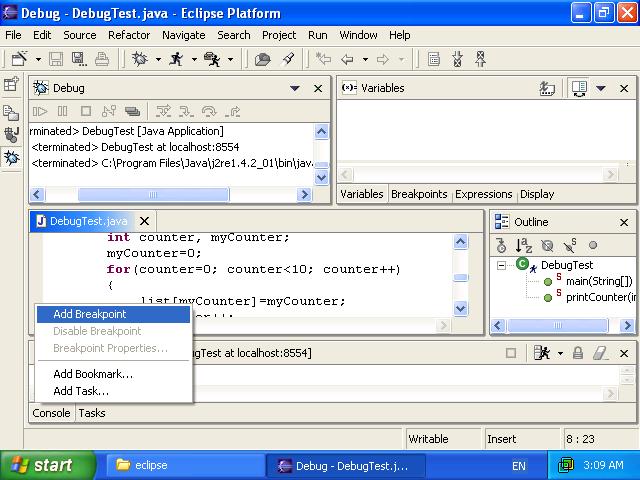
Choose "Add Breakpoint" and a blue dot should appear beside that line.
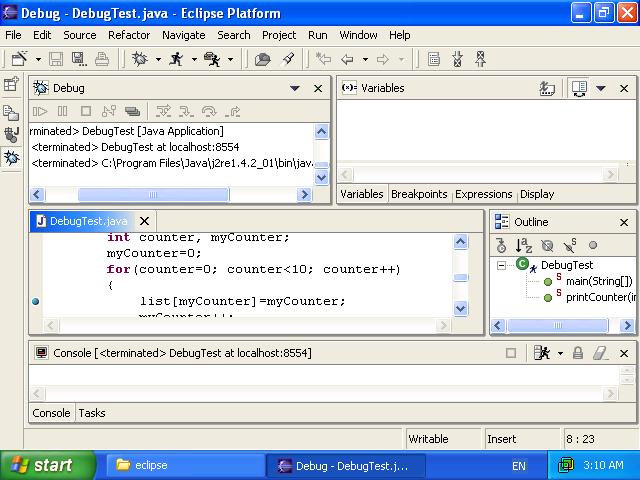
Now start the Debug again (Debug icon -> Debug As -> Java Application). After Eclipse readies itself it will start running the program, but will stop soon after. Eclipse has paused the execution of the program just before it runs the line "list[myCounter]=myCounter;". Eclipse will pause before any line marked with a breakpoint.
You will notice the "Variables" view is now populated with variables defined in the program, args is the parameter passed to main ("public static void main(String[] args)"), list, counter and myCounter are defined in main. It also reports the values of the variables. You can drop down the list item and see all the elements in the array.
Now to play with the debugging features. Click the play button in the "Debug" view (the one next to the pause and stop buttons). This will start the program running, but it will stop again because the program cycles through the loop, then comes back to the same line of code where we placed the breakpoint. You will see however, that some of the items in the "Variables" view are now red. This indicates all variables that have been changed since the last pause. If you drop down the list variable and press the play button again, you will see that it has also highlited the element of the array that has changed.
In the Debug view are three important icons (![]() ).
These are the "Step Into", "Step Over", "Step Return". Lets take a moment to
explain in theory what these do.
).
These are the "Step Into", "Step Over", "Step Return". Lets take a moment to
explain in theory what these do.
These three buttons will step through the program one line at a time, however
each one works a little differently.
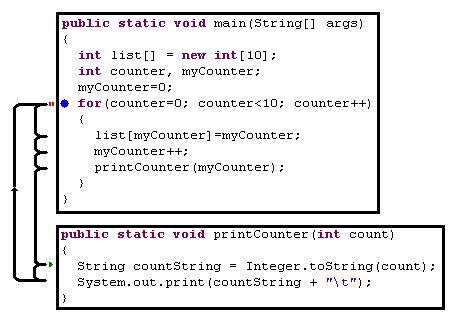
The "Step Over" (![]() ) will step through lines in a method, but will
not follow sub-methods (although they still run, it doesn't pause within them),
it will
continue in the one method, until it ends and returns to the calling
method.
) will step through lines in a method, but will
not follow sub-methods (although they still run, it doesn't pause within them),
it will
continue in the one method, until it ends and returns to the calling
method.

The "Step Into" (![]() ) will step line-by-line, but when it reaches a method,
it will jump into that method, and step each line within the sub-method. For
example, if you push this a few times Eclipse will reach printCounter, then jump
into that method, and step through the lines within it.
) will step line-by-line, but when it reaches a method,
it will jump into that method, and step each line within the sub-method. For
example, if you push this a few times Eclipse will reach printCounter, then jump
into that method, and step through the lines within it.
The "Step Return" (![]() ) will finish running a method, then return to the
calling method and then pause.
) will finish running a method, then return to the
calling method and then pause.
To start using these, press the "Step Over" a few times, and watch what it does. It will cycle the same four lines until the program ends, without following any methods. Keep pressing it until the line "printCounter(myCounter);" is highlited, then press the "Step Into". Eclipse has now contined stepping through the program, but has followed the flow of the program into the printCounter method. Using the "Step Into" only works with methods you have written. It will not work with Java API methods, because we can't see the source code for those. If you do try to do this, Eclipse will show a "Class File Editor - Source Not Found" window.
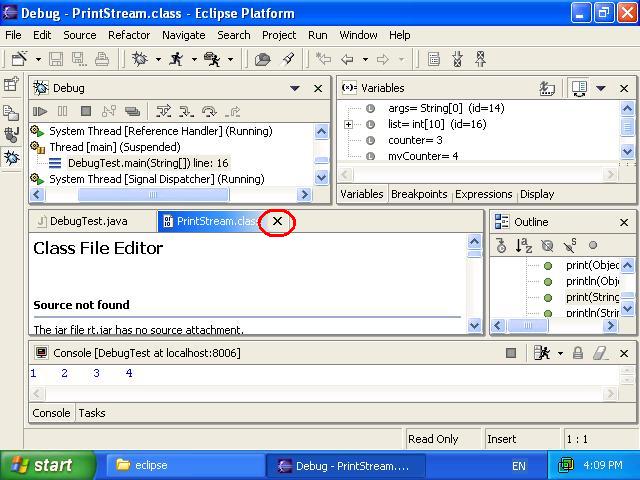
If this appears you can simply close this window and continue debugging.
If your program reaches the end of the program after pressing one of the step
buttons, it may show the "Class File Editor - Source Not Found" for "Thread.class".
This is the Java built in methods working to close your program. If you see this
at the end of your program, simply press the play button to let the program exit
normally.
Continue pressing the "Step Over" button. Eclipse will keep stepping through lines, exit the printCounter method, then continue looping round and round in the for loop. Press the "Step Over" button until you reach the "printCounter(myCounter);" line again, then press the "Step Into". Eclipse has now highlighted the first line of the printCounter method again. Now press the "Step Return" button. you will notice that this jumps back into the main method again, into the for loop. What eclipse has done is to finish running the printCounter method, and return back to the main method, highlighting the next line after the printCounter method.
Next Section: Finishing it off